Spatineo has launched a freely accessible visualisation of the availability of spatial web services organized by country and administrative area. This tool provides never before seen insight into the development of the European Spatial Data Infrastructure (SDI) and INSPIRE, particularly how the scope and availability of these services have developed over time. Spatineo offers SaaS tools, such as Spatineo Monitor, for the analytics and quality assurance of spatial web services.
Service Availability is vital for SDIs
The vision and goal of the INSPIRE legislation is to simultaneously open more data and increase its use. We at Spatineo believe it is crucial to show that organisations are working hard to fulfil their obligations. This transparency is necessary to inspire the private sector to discover and trust the spatial web services that can enable companies to both innovate and build new businesses that utilise the open spatial data.
Accurate and timely information on service quality lets data providers react faster and steer development resources more efficiently. Spatineo has helped numerous organisations improve the quality of their services by providing them with indispensable information on both what the actual service level of their services is and what factors influence their services availability. Until now, no one has even attempted to assess this on the SDI level. For instance, the advancement of INSPIRE has thus far only been tracked through manually compiled annual reports, which have not been publicly visualised or aggregated to form a big picture.
The technical quality of a web service is most often expressed in terms of its availability – generally, the percentage of time a specific service has been operational. Clients and suppliers often use availability as a benchmark in service level agreements, and European INSPIRE legislation compliance requires a level of 99% availability. There are many other factors underlying the quality of a spatial web service, such as spatial accuracy, comprehensiveness and consistency, but if a given service is inaccessible, no other qualitative measures apply since the data is altogether unavailable to users. Moreover, availability can also be compared across a wide range of different service types and classes; therefore it is ideal for evaluating a wide variety of services at once.
Collecting the data
Spatineo monitors tens of thousands of spatial web services globally. Quality assurance is the heart of our business and we pride ourselves in being a trustworthy neutral party who provides unbiased results. We have also participated in the development of both Open Geospatial Consortium (OGC) specifications and INSPIRE technical guidance documents. This puts us in the unique position of being able to build a tool that efficiently visualises all the hard work of the GIS community in Europe.
Spatineo harvests available spatial web services from service catalogues and search engines to keep its registry up to date. For the purposes of the map, services are broadly defined as any service endpoint that is described by a single service description document of a particular service type. For example, each WMS Capabilities document describes a single service. All services within our catalogue are continuously monitored. This monitoring procedure is compliant with the INSPIRE normalized testing procedure for availability and has provided us with data spanning back to 2012. To construct the map, availability results for each service are continuously tested month-by-month against the 99% availability threshold (not counting pre-announced maintenance windows) consistent with INSPIRE requirements.
Our service registry is enriched by additional information on the organisations providing these services. Service availability monitoring data and organisation information is then aggregated based on the sphere of influence of each organisation to provide summaries for each country.
Map visualisation
The Service Map is accessible through an easy to use website (see http://servicemap.spatineo.com/) that lets users view both the current status of European SDI development and overall trends. Users can examine Europe as a whole or focus on specific countries to compare different administrative areas.
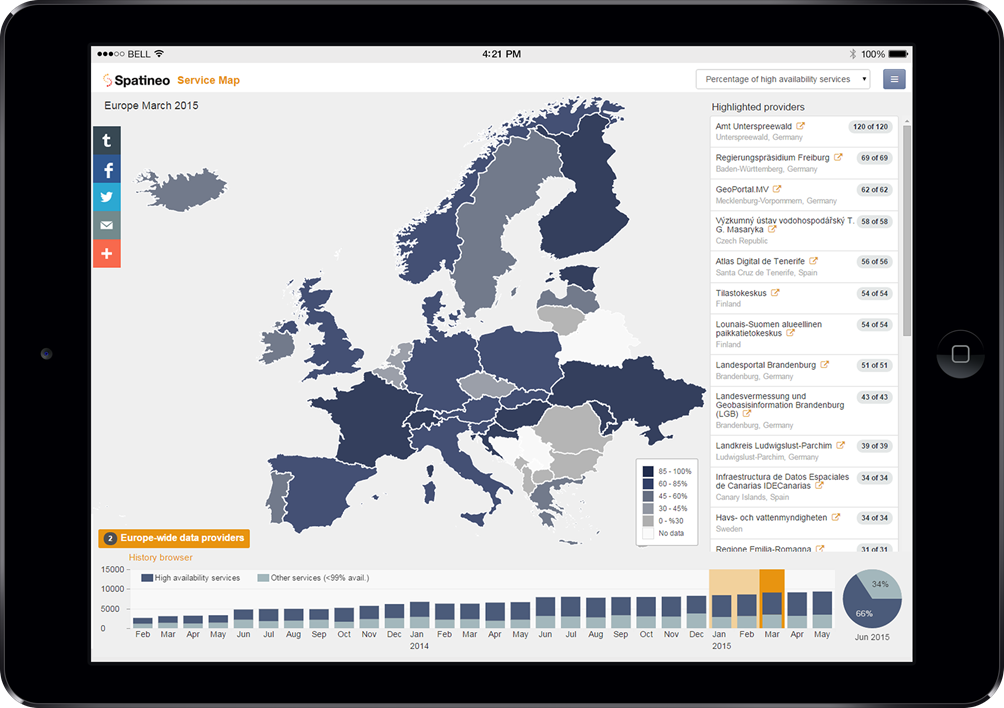
The shading of each country indicates the percentage of high-availability services while the bars on the bottom show the number of both total services and high-availability services over time. Users can choose to inspect either the current month or any previous month.
Not only does this tool aggregate data by geographic areas, it also provides insight into the top spatial data providers in Europe. Top organisations are listed according to their average service availability and the number of services they each provide. Additionally, data providers that have recently increased the availability or quantity of their services are highlighted.
The high level SDI status data shown on the map immediately reveals that there is healthy growth in this sector. The quantity of spatial web services has continued to grow steadily over the past two years and the number of compliant services available is very promising. We highly recommend that you visit servicemap.spatineo.com to explore the map yourself. The data used for our visualisation is constantly improved as new organisations and services are identified.
The technology behind this map can also be applied to more specialized cases. For instance the European Location Framework project (ELF) uses another map based on the same software. Their project amasses services from multiple countries and multiple service providers into a single harmonized map interface to guide decision making, drive eServices development and empower citizens. Our Service Map provides a high level view on the services involved and helps assess the strategic success of their project.
Moving forward
We have not yet seen wide adoption of the spatial web services provided by the public sector. Achieving widespread use requires not only good quality data and services, but also that the existence of these services be communicated and advertised to companies and private citizens. Our Service Map promotes openness, which should increase public scrutiny of current service quality.
It is also important to remember that the whole is the sum of its parts. The Service Map is merely a visualisation and the quality of the actual services is key. For the actual service quality to improve, data providers should look for tools to monitor and analyse the quality of their services, tools such as Spatineo Monitor.